Pharmacy Spend Analysis in Employer Health Plans
Employers must break pharmacy costs into specific drivers to avoid costly budget mistakes.
Pharmacy has stopped behaving like a predictable line item and started behaving like the most volatile one on an employer's health plan budget. For years it just sat there, renewed each cycle with minor adjustments and little scrutiny. That era is over, and the data behind it shows as much.
In 2024, pharmacy expenses ate up nearly a quarter of all employer health care spend, according to the Business Group on Health's Employer Health Care Strategy Survey. Employers are forecasting a significant cost increase heading into 2026, driven by three forces at once: rising GLP-1 utilization for obesity, a wave of late-stage cancer diagnoses that require aggressive treatment protocols, and a growing pipeline of high-cost cell- and gene-based therapies. None of these three is a short-term blip that will fade with the next formulary update. Each reinforces the others, and together they have pushed pharmacy past the point where an annual renewal check is enough to manage it.
Business Group on Health's 2025 pharmacy year-in-review confirms that these forces pushed employers to dig into cost drivers with far more rigor than before, and the vast majority of large employers now say they're concerned about pharmacy costs heading into 2026. Alliant's February 2026 analysis names the structural flaw that produces that concern: a small segment of utilization drives most of the financial risk, while the reporting tools employers rely on still treat pharmacy as one uniform expense. That mismatch, between where the risk actually sits and how the numbers get reported, is where plan sponsors lose control of their budgets. The rest of this piece is about closing that gap.
What aggregate pharmacy trend reports hide
Aggregate trend figures do one thing well: they tell an employer that pharmacy costs went up. They cannot say why, and a plan design response built on a number alone will usually fix the wrong problem. Alliant's analysis is direct about the consequence: when visibility stops at an aggregate trend line, employers get pushed toward decisions that trade predictability for simplicity, typically broad cost-shifts that spread pain across every member without touching the specific sources of volatility.
Concentration is where this breaks down fastest. A single employee on an oncology therapy, or a single employee on a rare disease treatment, can generate pharmacy spend that outstrips the combined pharmacy cost of a much larger share of the workforce. That fact does not appear in a report that only shows aggregate trend. It shows a number moving up and offers no way to trace where the movement came from.
Standard PBM reporting compounds the problem, because those reports are built around claims processed, not what actually drives cost. Rebate flows, spread pricing, and specialty pharmacy margin don't appear in a standard claims summary, so the plan's true net cost is not the number sitting on the report. NFP's 2026 U.S. Benefits Trend Report on Rx Trends treats spread pricing and cost transparency as a single combined issue rather than two separate topics, and that framing says something on its own: the tools most employers use to read their pharmacy data were not built for the cost environment pharmacy has become. Better data doesn't eliminate pharmacy costs by itself, but without it, no design decision an employer makes can be aimed at the right target.
The components of a rigorous pharmacy spend analysis
A useful pharmacy spend analysis breaks cost apart by driver, so it doesn't just report a single trend line. So you separate specialty drugs from traditional ones, you measure claimant concentration directly, and you split GLP-1 spend from oncology spend and rare disease spend instead of lumping all three into one pharmacy category.
The inputs that make this possible are specific. Claims data has to be broken out by drug class and tier, not collapsed into one pharmacy total. Net cost after rebates has to replace the allowed amount as the number employers actually look at, since the allowed amount reflects spend before the PBM extracts its revenue, not what the plan actually pays. Claimant-level concentration needs its own view: what share of total pharmacy spend comes from the top claimants, and which therapies are responsible for it. And you need to check stop-loss interaction directly: which claims are approaching or exceeding the individual stop-loss deductible, and whether the stop-loss coverage in place was ever sized for the specialty drug exposure the plan now carries.
GLP-1 spend needs a sub-analysis of its own: coverage scope (diabetes only versus obesity), how far prior authorization has penetrated the covered population, spend per covered contract, and whether utilization management arrangements are preserving rebate revenue or forfeiting it. Truveris's 2026 pharmacy trends analysis shows GLP-1 spend concentrating specifically where coverage persists, so a plan that hasn't segmented its GLP-1 data out from the rest of its pharmacy spend has no way to tell how much of its overall increase this one drug class is responsible for.
None of this requires new software platforms or a vendor relationship most employers don't already have. It requires asking the PBM or consultant for data cut a specific way, and treating the absence of an answer as information in itself.
Specialty Drugs and GLP-1s Concentrate Cost
Specialty drugs and GLP-1s are expensive, but the more important fact is that they concentrate cost asymmetrically. A plan built around average utilization has no mechanism for absorbing that kind of exposure.
On the specialty side, individual oncology therapies such as Darzalex Faspro and Keytruda routinely carry price points that exceed average individual stop-loss deductibles on their own. A single covered employee starting one of these treatments can trigger that exposure by themselves. Specialty drug claims are now among the most common triggers for individual stop-loss reimbursement. The plan's financial risk sits concentrated in a handful of people rather than spread across the workforce the way aggregate trend figures imply. The plan's Tier 4 design, meaning copay level, coinsurance structure, and formulary controls, is the main lever available for managing that exposure before a claim ever reaches the stop-loss threshold.
GLP-1s concentrate cost differently but just as forcefully. Business Group on Health's survey found that a large majority of employers are already seeing increased utilization of obesity medications, with nearly all of the remainder expecting it soon, making this cost pressure near-universal. Truveris's data shows that where coverage for weight-loss GLP-1s stayed in place, average spend per plan sponsor roughly doubled between 2023 and 2025. The cost did not spread thin across the plan population; it concentrated among the sponsors that kept coverage open without guardrails. New oral formulations will push this further: the first oral Wegovy formulation entered the market in early January 2026, and Eli Lilly's orforglipron, which Truveris had expected to clear FDA review as early as the second quarter of 2026, was approved on April 1, 2026. Employers who haven't set a coverage policy before these formulations expand access further are making a default decision.
The PBM contract as a hidden cost layer inside every pharmacy spend number
The number on a pharmacy claims report is not the number the plan actually pays. The real figure is the allowed amount minus rebates, adjusted for spread pricing and specialty pharmacy margin, and calculating it at all depends on whether the PBM contract gives the plan the right to see those components.
The traditional PBM revenue model is built around exactly the kind of opacity that makes this hard. PBMs earn money through administrative fees; through spread pricing, where they charge the plan more for a drug than the pharmacy itself receives and keep the difference; through manufacturer rebates paid in exchange for formulary placement; and through margin on specialty pharmacy dispensing. These costs are absent from a standard report, and several of them run counter to what the employer is actually trying to achieve on cost.
Three PBMs, Express Scripts (owned by Cigna), CVS Caremark (owned by CVS Health, which also owns Aetna), and OptumRx (owned by UnitedHealth Group), manage pharmacy benefits for the vast majority of covered lives in the United States. Each is affiliated with a major medical carrier, so an employer using an ASO arrangement often ends up with that carrier's affiliated PBM by default, without any active evaluation.
GLP-1s add a further wrinkle to this picture. Business Group on Health's survey notes that rebates tied to GLP-1s are reduced or eliminated entirely under certain utilization management arrangements. If you add prior authorization or a weight management program requirement, you take a legitimate cost-control step, but you can forfeit rebate revenue the plan was counting on, and you won't see that trade-off without contract-level data showing how the rebate terms are structured. Independent PBMs operating on transparent, pass-through pricing offer a structural alternative: they return rebates to the plan in full. Business Group on Health treats exploring these transparent models as a necessary response to current cost pressure, not an optional upgrade, and the survey found that more than four in ten employers, 41%, are either changing PBMs or running a PBM RFP right now. So the old model's opacity no longer matches the stakes involved.
What biosimilar substitution and formulary controls can move
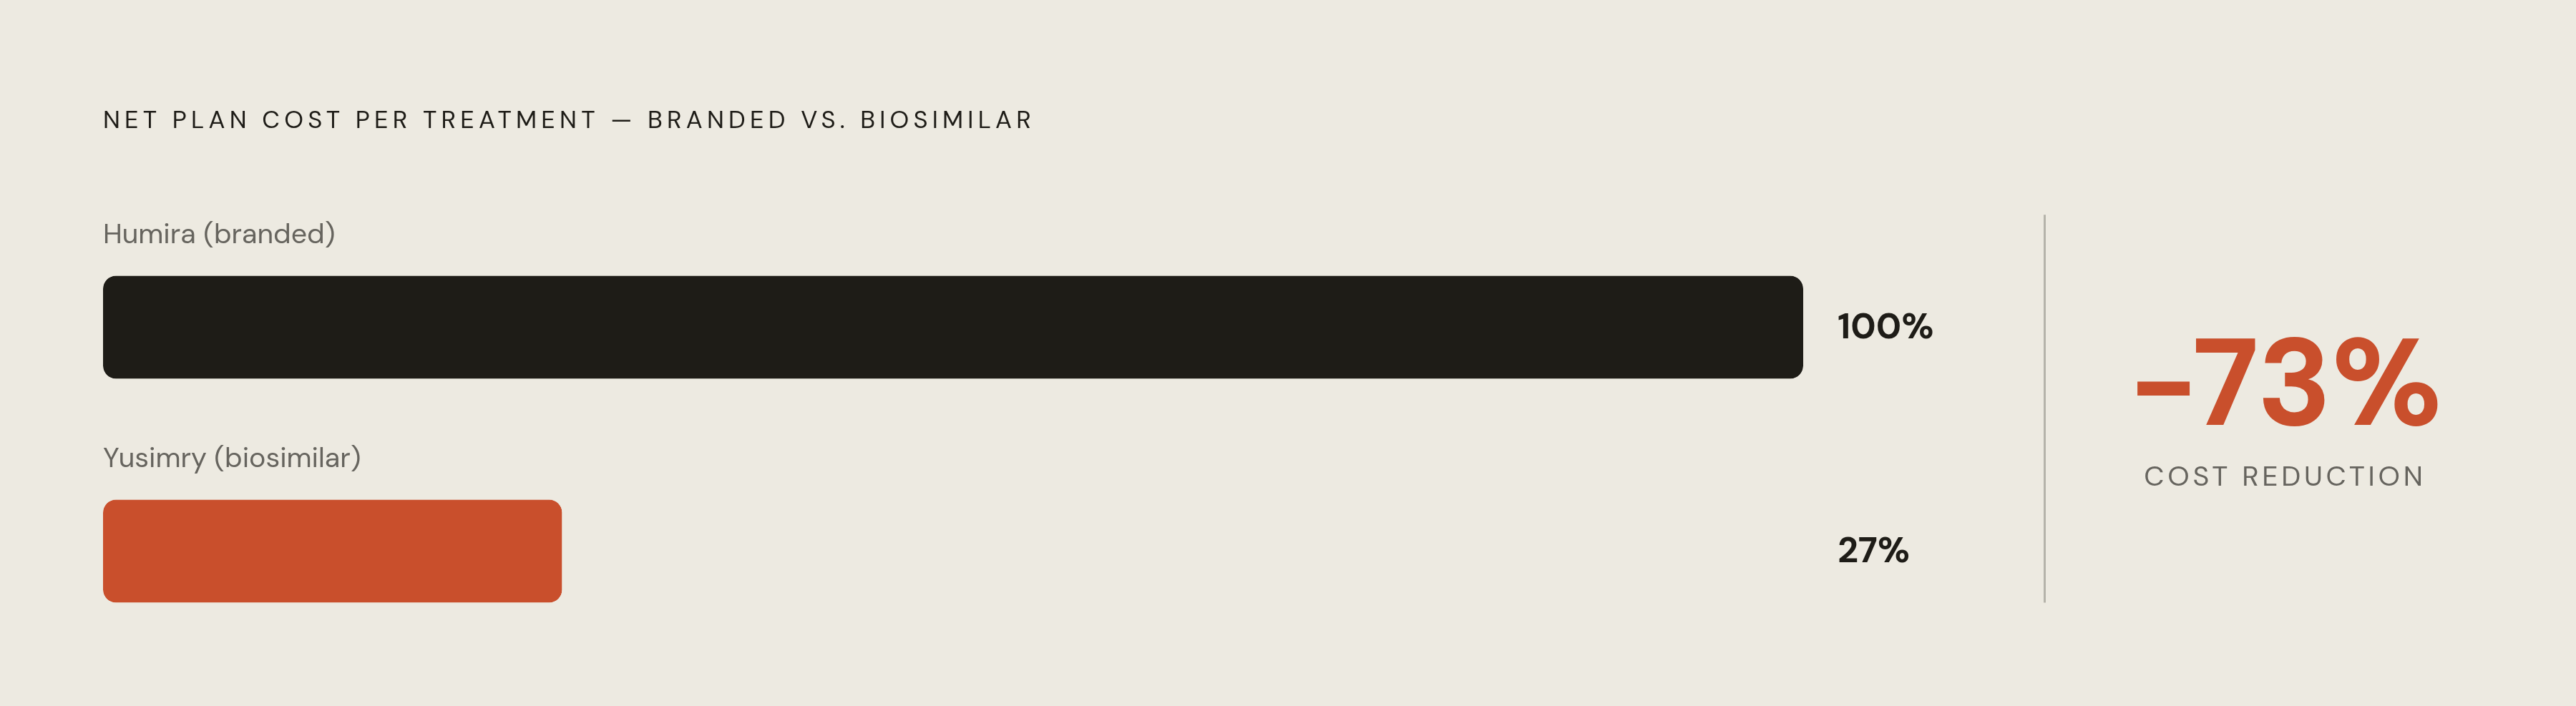
Biosimilar substitution is the clearest, most immediately quantifiable lever most employers have for reducing pharmacy spend, and plans that haven't executed a transition plan are leaving real savings unused.
Humira and its adalimumab biosimilars are the clearest case. The net price gap between Humira and the biosimilar Yusimry is large: moving a member from one to the other cuts net plan cost per treatment by roughly 73%. For a plan with even a handful of members on branded adalimumab, that difference adds up to a material amount across a full year. Stelara biosimilars reached meaningful, though still minority, adoption in 2025, and Truveris expects a similar cost trajectory to play out there over time, which makes Stelara the next wave of savings for plans that already moved early on Humira.
Beyond biosimilar substitution, several formulary controls give plan sponsors more direct influence over specialty and GLP-1 cost. Step therapy requires a member to try a lower-cost alternative before a higher-cost drug gets authorized, and it applies especially well to GLP-1s and specialty biologics. Prior authorization requires clinical review before a high-cost drug gets dispensed, and as already noted, it can change what rebates the plan is eligible for. If you direct specialty fills to a designated specialty pharmacy, the plan gets better pricing and you get better visibility into what's actually being dispensed. Formulary exclusions remove non-preferred brand drugs from coverage when a therapeutically equivalent alternative exists, which lowers Tier 4 cost without removing clinical access to treatment.
None of these controls are about restricting care. They ensure the plan's formulary reflects a deliberate choice. Intercept.health's 2026 planning guide frames the range well: employers that put these controls in place can realize meaningful pharmacy savings while maintaining or even improving employee satisfaction, and the savings freed up become available to reinvest elsewhere in the benefits program.
GLP-1 Coverage as a Plan Design Choice
GLP-1 coverage carries enough weight now that it functions as its own plan design decision, not a clinical afterthought buried inside the broader specialty formulary. Deferring the decision doesn't avoid it; the plan still ends up with a de facto policy, just one nobody chose.
The first fork in the decision is coverage scope: covering GLP-1s for diabetes only, versus extending coverage to obesity treatment as well. The financial consequences of that choice diverge sharply, because utilization patterns, rebate structures, and the practicality of prior authorization all differ between the two indications.
This decision carries a workforce dimension that goes beyond cost. NFP's 2026 U.S. Benefits Trend Report finds that GLP-1 coverage has become a factor in talent retention: nearly a third of employees say they'd consider switching employers to gain access to it. That elevates the question above a pure cost calculation and into competitive benefits strategy.
Among employers that do cover GLP-1s for obesity, more are adding guardrails: prior authorization, participation in a weight management program, or a requirement that the prescription come from a specific type of provider. That marks a shift from open-ended coverage toward structured coverage meant to manage both cost and outcomes at once. But the guardrails carry the same rebate trade-off described earlier: adding them can reduce or eliminate GLP-1 rebates under some PBM contracts, so the financial case for tightening coverage isn't straightforward without a contract-level look at what's actually at stake.
Policy risk adds one more layer of uncertainty. Truveris's 2026 analysis flags Most Favored Nation pricing and the announced "TrumpRx" direct-to-consumer platform as developments that could reshape GLP-1 pricing materially. You should build flexibility into your coverage design, rather than lock in assumptions about today's pricing holding steady. Direct-to-consumer programs such as Novo Nordisk's Novocare and Eli Lilly's LillyDirect add a further complication: members who buy through these programs generate no claims data, which disrupts PBM utilization reporting and can affect the pricing thresholds built into a PBM contract. The worst position for an employer to be in is the one many are in by default: no coverage policy decided deliberately, a formulary shaped by inertia, and a renewal date arriving before anyone has looked at the data closely enough to choose.
Connecting Pharmacy Spend Analysis to Plan Design Action
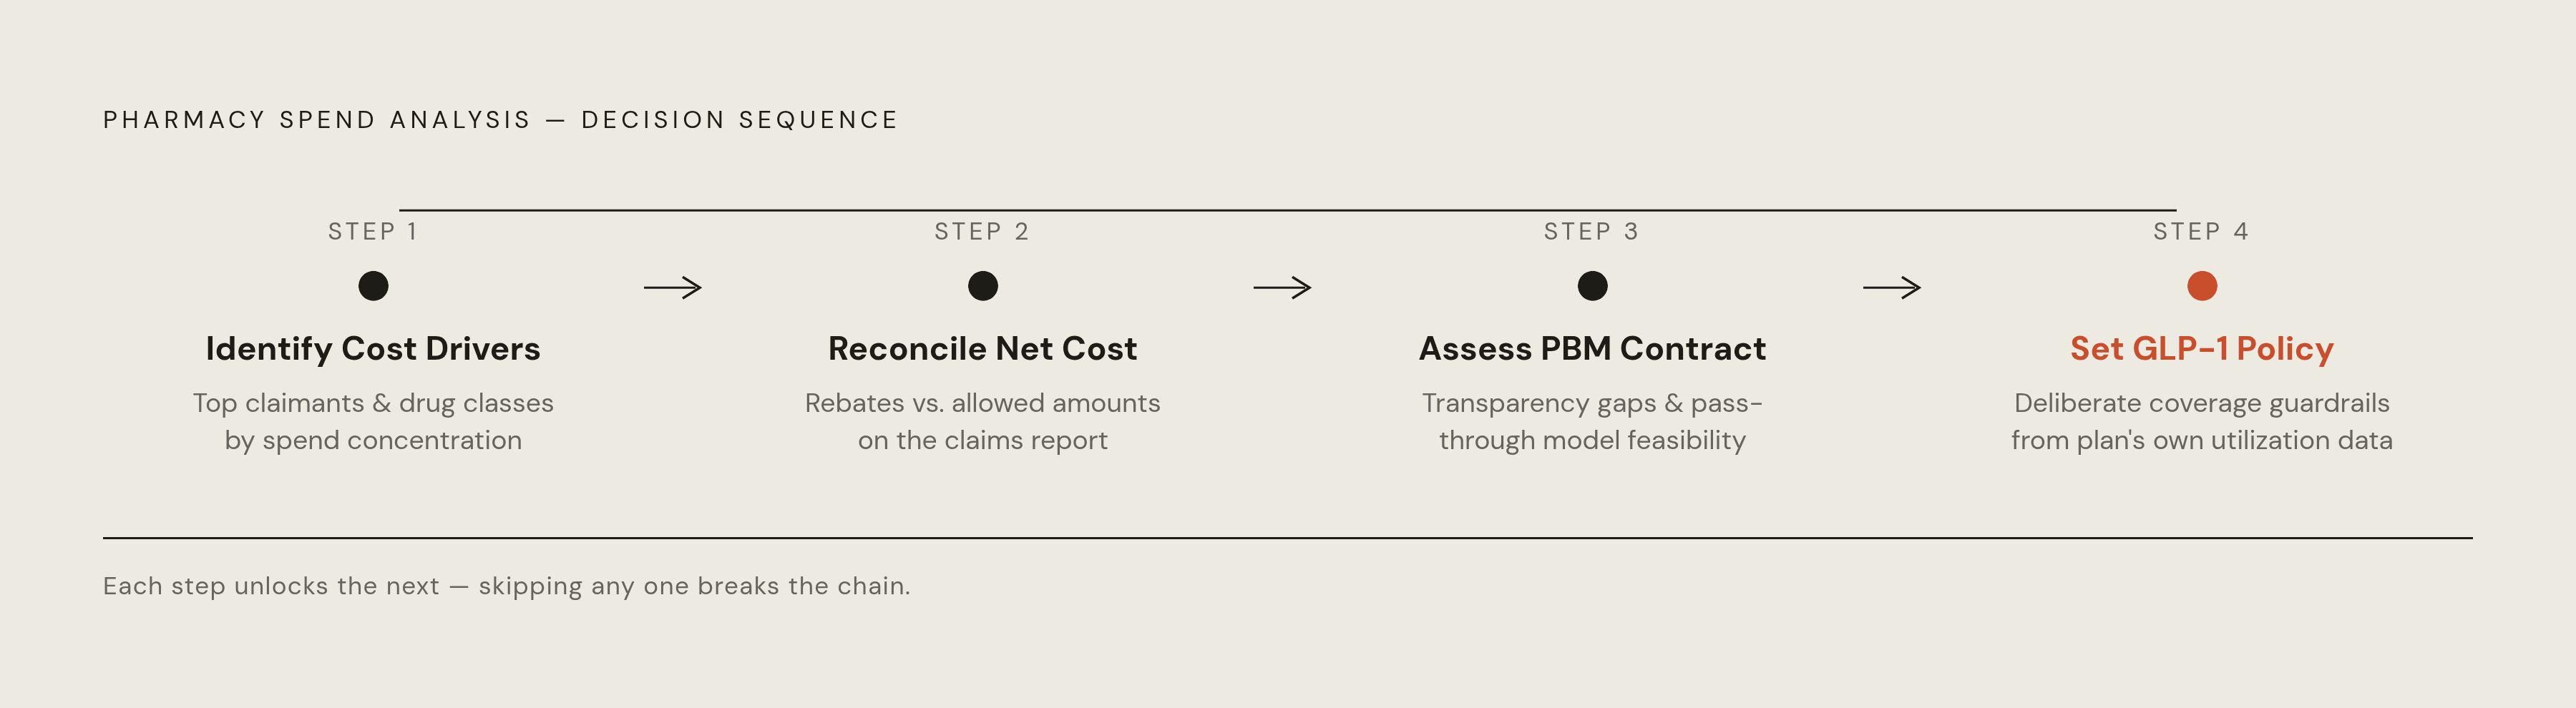
A pharmacy spend analysis is the input to a specific sequence of decisions covering formulary design, PBM contracting, stop-loss sizing, and GLP-1 coverage policy.
That sequence runs in a fairly consistent order. Start by identifying the top claimants and drug classes driving cost concentration, since that tells you whether the most urgent priority is a biosimilar transition, GLP-1 guardrails, or a stop-loss restructuring. Next, compare net cost after rebates against the allowed amounts on the claims report, because that comparison shows whether the current PBM contract is delivering real savings or masking cost through spread pricing. From there, check whether the PBM contract gives you enough transparency to decide, and work out whether an RFP for a pass-through model makes financial sense given the plan's specialty drug volume and rebate flows. Finally, set a GLP-1 coverage policy on purpose, with guardrails built around the plan's own utilization data rather than industry averages that may not reflect its workforce.
Insurica's 2026 analysis and Business Group on Health's survey both land on the same conclusion from different directions: pharmacy cost pressure can't be fixed through plan design changes alone. The PBM model, the rebate structure, and the formulary strategy all have to be addressed together, and that's precisely what a rigorous spend analysis is built to make possible.
This matters in a specific way for tech companies. Pharmacy spend analysis at this level of detail needs claims data that self-funded plans generate directly, and fully-insured and other pooled arrangements often can't get that data. The ability to run this kind of analysis in the first place is one of the structural reasons employers move to a self-funded or level-funded plan once their headcount can support the risk.
An AI-native benefits advisor with access to carrier pricing data and plan-level analytics can run this kind of analysis at renewal, not only when a cost crisis forces the question. That advisor can connect the findings straight to formulary decisions, carrier negotiations, and PBM contract evaluation, without the employer needing to hire a separate consultant for each piece of the work.