Preventive Care Utilization as a Leading Cost Indicator
Early warning signs in your claims data predict where costs spike in the next two years.

Preventive care utilization is a leading indicator of where an employer's health plan costs are headed over the next one to three renewal cycles, and the claims data that would show this is already sitting in most plans, largely unread.
Why employer health costs keep rising
Aon's analysis projects a 9.5% cost increase in 2027, the fourth straight year of near double-digit growth, and that will push average costs above $19,000 per employee. Mitigation reduces costs, but only partially: on a compounded basis, employer costs are likely to run 62% higher than 2017 levels. Employers have shifted some of that burden onto workers, too. Aon reports that employee out-of-pocket costs reached $2,167 in 2026, even as employers kept absorbing roughly 82% of total plan cost. None of these tools, cost-sharing, vendor swaps, plan redesign, change the fact that they all respond to spending after it has already happened. The open question for any employer running this math at renewal is simple: how do you see the spike coming before the invoice lands?
Preventive Care Utilization and Future Spending
When an employee skips a mammogram, delays a primary care visit, or lets a biometric screening lapse, the cost of that care doesn't disappear. Elite Corporate Medical's 2026 analysis found that higher deductibles often push employees to delay primary and preventive care, which drives up emergency and inpatient costs down the line. That deferred-care loop produces every other effect described in this argument. The pattern is visible well before it becomes expensive: rising fasting glucose, a worsening lipid panel, a missed cancer screening are all detectable in routine plan data years before they turn into a diabetes diagnosis or a late-stage cancer finding. Business Group on Health has made the logic explicit, pointing employers toward cancer prevention and screening coverage, including alternatives to colonoscopies and expanded breast cancer screening, because catching disease at an earlier stage is dramatically cheaper to treat. The distinction that separates a useful metric from a vanity one comes down to the question being asked of it. Read as a lagging number, preventive utilization only tells you what employees did last year. Read as a leading indicator, it tells you what the plan will spend over the next one to three renewal cycles. The gap between those two readings is where real plan intelligence lives.
The five cost drivers where low preventive utilization creates the earliest detectable signal
The conditions consuming the largest share of employer health budgets happen to be the ones with the longest runway between an early warning sign and a costly claim. That overlap is what makes preventive utilization data most valuable exactly where cost pressure is worst.
Cancer is the top cost driver for the fourth consecutive year, and a large majority of employers already rank it among their top three cost concerns. Screening gaps, employees who aren't current on mammography, colorectal screening, or lung cancer CT, appear in claims data and predict the later-stage diagnoses that drive the costliest treatment episodes, including CAR-T therapy and immunotherapy. Employers are responding directly: 58% expanded preventive care for women in 2026, up 22 percentage points in two years.
Metabolic disease, diabetes and pre-diabetes, offers the clearest case of a long upstream window. Business Group on Health reports that 79% of employers have already seen an uptick in GLP-1 use, with another 15% expecting increases, a cost trajectory that traces straight back to missed early-intervention windows.
Musculoskeletal conditions affect a large share of U.S. adults and account for more than $300 billion in total direct medical spending, and Aon names MSK alongside cardiovascular disease as a primary driver of escalating medical costs. Low engagement with physical therapy, ergonomic assessment, or digital MSK programs predicts higher surgical rates. Utilization of early-intervention programs predicts surgical claim volume directly.
Mental health shows a similar pattern with wider reach. Coverage isn't the problem: EAP and mental health benefits are nearly universal, but equitable engagement across demographics often isn't, which makes utilization, not access, the number that matters.
Cardiovascular disease rounds out the list. Aon names it alongside MSK as a primary cost driver and notes that GLP-1 therapies are expanding into cardiovascular care, adding pressure from both the treatment and prevention sides. Biometric screening participation and lipid panel compliance predict cardiovascular event risk at the population level, giving plan sponsors early warning of a claim category that produces some of the highest individual payouts on the plan.
Across all five, the thread is the same: low preventive utilization now predicts high-cost claims later. None of these signals matter unless someone is actually reading them.
How Plan Data Reveals Utilization Gaps
Self-funded and level-funded employers already have claims feeds that show, at the population level, which preventive services employees are using, which they're skipping, and where they're landing instead, urgent care, the ER, an inpatient bed. The data is there. The question being asked of it usually isn't the right one. Most benefits reporting answers "what did we spend?" asking instead "where are screening and prevention gaps concentrated, and what does that predict about the next 24 months of claims? The first question produces a ledger. The second produces a risk instrument, and most employers are only building the first.
Elite Corporate Medical's analysis points out that self-funded arrangements give employers far more visibility into what's driving spend, including claims data and pharmacy detail, than fully insured plans, where the carrier keeps that intelligence to itself. There's a feedback loop working against employers here, too. The plan design meant to save money in year one quietly degrades the employer's ability to see risk coming in year three.
The ACA requires non-grandfathered plans to cover specified preventive services without cost-sharing, but that's a floor, not a strategy. Whether employees know the coverage exists, and whether plan communications actually drive them toward it, is an operational gap most HR teams underestimate. KFF's 2025 Employer Health Benefits Survey found that 83% of large firms offer at least one wellness program, but it documents no finding about whether employers can measure the downstream impact of those programs on claims. Employers are, in large numbers, funding engagement without any way to tell whether it's translating into the utilization patterns that predict lower future costs. Reading the data this way takes a different question, a different cadence, and often a different partner than most employers currently have in place.
The Pre-Diabetes and MSK Cases and the Missed Upstream Window
Pre-diabetes and musculoskeletal disease show, with unusual clarity, how large the financial gap is between acting early and acting late, large enough to reshape a plan's entire cost trajectory.
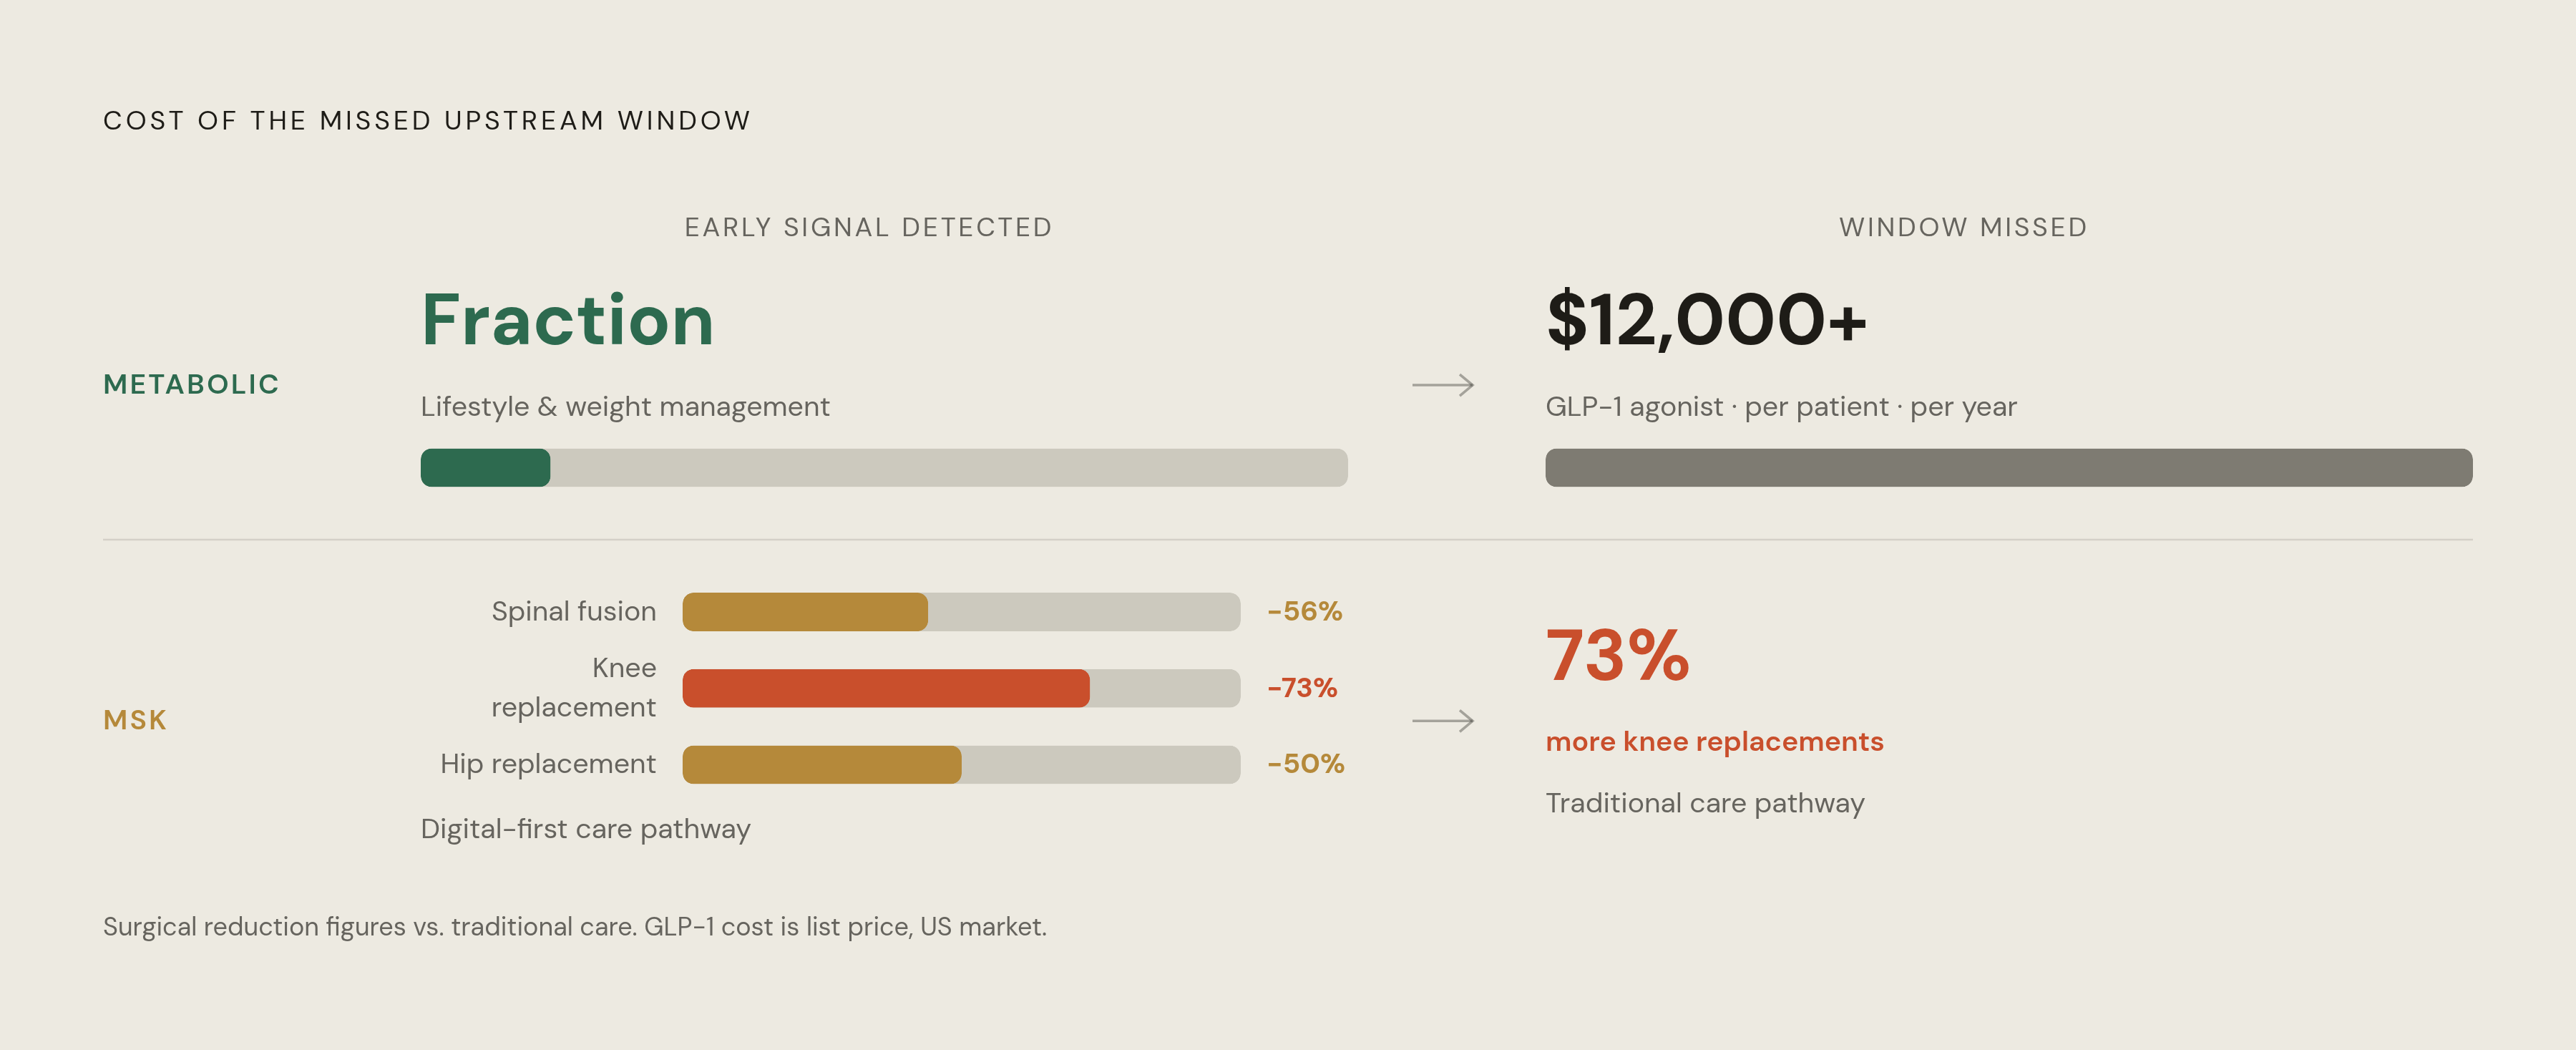
Start with pre-diabetes. Compare that to GLP-1 receptor agonists, now running approximately $12,000 or more per patient per year and the fastest-growing new line item in employer pharmacy budgets. The signal that predicted this cost wave was visible well in advance: low participation in biometric screenings, HbA1c testing, and weight management programs, all measurable in plan data, flagged the GLP-1 surge before it arrived. Employers are now requiring utilization management and weight management program participation as conditions of GLP-1 coverage, a downstream fix that would have mattered less had the upstream signal triggered action earlier.
The MSK case runs in parallel. A 2025 Hinge Health report found that digital-first MSK care pathways reduced spinal fusions by 56%, knee replacements by 73%, and hip replacements by 50% compared with traditional care. Low engagement with physical therapy or digital MSK programs in a given year is a forward-looking indicator of elevated surgical claim volume in the years that follow, not a guarantee, but a statistically meaningful signal at the population level. MSK surgical claims rank among the highest-cost non-oncology claims on most employer plans, and catching the upstream signal, low conservative-care engagement, carries more value than any cost-sharing adjustment applied after a surgical authorization is already in motion.
Both cases share the same structure. A detectable window opens, a low-cost intervention exists to close it, and a high-cost outcome follows when that window is missed. That structure makes preventive utilization a leading indicator, not a feel-good number on a benefits deck.
How plan design choices generate or suppress the preventive utilization signal
Plan design isn't neutral with respect to the signal it produces. Employers who use cost-sharing to push down utilization are, at the same time, suppressing the data that would tell them where risk is building. Elite Corporate Medical's 2026 analysis documents the loop directly: higher deductibles push employees to delay primary and preventive care, and that delay raises emergency and inpatient costs later. A leaner plan built to cut near-term premium cost produces exactly the utilization gaps that generate larger claims down the road. Aon ties part of the rise in employee out-of-pocket costs to enrollment in these leaner options, plans that lower premiums for both employer and employee while raising the cost-sensitivity that keeps people away from preventive visits.
The lever runs the other way, too. Elite Corporate Medical points to lower cost-sharing for high-value primary and preventive care as a design choice that aligns employee incentives with the visits that generate useful risk data. The ACA floor sets a minimum, non-grandfathered plans must cover specified preventive services without cost-sharing, but meeting that floor isn't the same as designing a plan that actively drives employees toward the services functioning as leading indicators. Business Group on Health's survey notes that employers are exploring non-traditional health plan and PBM models and evaluating vendor performance against outcomes, so they increasingly ask whether plan investments generate the utilization patterns that predict lower future costs, rather than whether they produce savings this year alone. The tension employers are actually navigating at renewal is between a design that helps this year's budget and a design that protects the next three years of claims.
What Employers Who Read Preventive Utilization as a Cost Signal Do Differently
Employers who treat preventive utilization as a cost signal act differently from those who treat it as a wellness metric. They benchmark it, respond to gaps before renewal, and judge vendors by whether engagement actually predicts a reduction in downstream claims.
Business Group on Health reports that employers are pushing workforces toward health plan navigation tools to find high-value care, expecting more people to use primary care and get recommended screenings and immunizations, framed as cost management, not as a wellness perk. About half of large employers plan to offer cancer-focused centers of excellence in 2026, with enhanced screening coverage and personalized navigation built in as a structural commitment, not an add-on benefit. Preventive care for women is moving at a similar pace: 58% of employers are expanding it in 2026, up 22 percentage points in two years, a recognition that the gap is both clinical and financial.
Vendor evaluation is tightening alongside this. More than half of employers are changing or running RFPs for health and well-being vendor relationships, holding those vendors accountable for measurable utilization and downstream cost effects, not participation counts alone. The Hinge Health MSK data gives employers a template for this kind of accountability: a direct, documented line between digital-first care engagement and lower surgical rates.
Benchmarking needs to happen every renewal cycle, not just once. Plan design gets measured against the market at every renewal, and preventive utilization rates deserve that same scrutiny, so the employer gets a forward-looking signal to sit alongside the backward-looking cost report. Elite Corporate Medical describes the shift toward value-based plan design differentials, lower cost-sharing for high-value preventive care, as an active choice that has to be revisited, not a default setting. Data access belongs in that same conversation. Elite Corporate Medical identifies claims data access, including pharmacy detail, as a primary reason more mid-sized and large employers are moving to self-funded arrangements. Without that access, the preventive utilization signal simply isn't visible to the employer. For those still fully insured, "what preventive utilization data do we actually get?" belongs in the renewal conversation right alongside the premium rate. Acting on all of this well takes a partner whose incentives line up with using the data, not preserving however things already run.
Why the broker or PEO structure most employers are in complicates this analysis
The preventive utilization signal lives in plan data that most employers can't easily reach, interpreted, when it's interpreted at all, by advisors whose pay doesn't depend on acting on it. That is the structural reason the cost-of-delay argument keeps repeating at every renewal cycle unsolved.
Fully insured employers rarely see the claims-level data that would let them measure preventive utilization gaps at the population level. PEO co-employment arrangements add a third version of the same problem. The data needed to generate a usable signal sits at the PEO plan level, not at the employer's own level.
Employers are already signaling frustration with this setup. Business Group on Health reports that more than four in ten employers are changing PBMs or running RFPs, while more than half are doing the same for health and well-being vendors, a broad move toward holding advisors and vendors accountable for outcomes. The alternative that follows from this logic is an advisor whose value comes from the quality of plan analysis, reading workforce claims data alongside carrier pricing with the help of AI, rather than from commission size, and whose work includes watching preventive utilization trends between renewals, not just at them. An AI-native brokerage built on top of an employer's existing HRIS can offer that kind of continuity without asking the employer to rip out infrastructure or take on co-employment. The cost of standing still is already on the record: Aon's analysis shows employer health care cost increases have more than doubled since 2022, a trend that reflects, in part, an advisory model built to react to cost increases after they occur. The employers best positioned for the next renewal cycle are the ones who start reading preventive utilization data as a leading indicator now, well before the spike raises the invoice.