Reading a Loss Ratio Report as an Employer
Understanding your loss ratio report gives you negotiating power at renewal.

The renewal letter arrives with a single number on it: 11%, 14%, 18%. Most employers respond to that number as though it were the start of the conversation, when the carrier has already finished its half of the math before the letter was printed. The actuarial foundation behind any renewal figure is the loss ratio, the share of collected premium the carrier paid out in claims, and the carrier knows this figure for the group with precision long before the employer sees a rate change. Carriers carry no obligation to share claims experience data proactively, and in practice, many brokers never request it and some would struggle to interpret it if they did. One side arrives with actuarial context while the other arrives with a budget constraint, and a loss ratio report exists to close that asymmetry.
What the loss ratio report measures
The formula itself is simple: Loss Ratio = (Total Claims Paid ÷ Total Premiums Collected) × 100. What matters is what each piece of that ratio signals about how the carrier views the group it insures. The loss ratio expresses the portion of collected premium the carrier paid back out in claims, and the remainder funds administration, reserves, broker commissions, and profit. A loss ratio above the carrier's break-even point means the group lost the carrier money over the period measured, and that group should expect the carrier to move aggressively at renewal to correct it.
The "simple loss ratio," calculated as claims divided by premium, is a different measurement than the ACA's Medical Loss Ratio calculation, which adjusts for quality improvement expenses and taxes. KFF notes that insurers in the individual and small group markets must spend at least 80% of premium income on health care claims and quality improvement efforts, and an employer reading a loss ratio figure needs to know which version of the calculation produced it before drawing any conclusion from it.
A single year's loss ratio is a data point. A three-year trailing average is an actuarial signal, and a loss ratio that climbs steadily across three years carries more weight than the current year's number taken alone. Employers also carry more leverage to request this history than most realize. ERISA Section 104(b)(4) establishes a legal right to request certain plan documents, including the summary plan description and the annual report, though a claims experience report is not among the documents specifically enumerated under that provision. Requesting a three-year trailing claims report anyway gives the employer the same actuarial picture the carrier already uses internally to price the renewal.
The industry-wide loss ratio environment and the employer's room to maneuver
Reading a loss ratio report matters more now because the market backdrop has tightened, leaving carriers less room to absorb an unprofitable group and less incentive to extend a favorable renewal out of inertia. Most of the country's largest insurers reported year-over-year increases in medical cost ratios in 2025, with most major carriers rising from where they stood in 2024.
In both the small and large group markets, 2025 average simple loss ratios sat at elevated levels, and carriers operating near or above those thresholds have little cushion left to offer favorable renewals without evidence that a specific group merits one. An employer might object that this is a carrier-level problem rather than an individual one, but that framing misreads how the adjustment actually happens. When carrier margins compress industry-wide, the renewal rate is the mechanism carriers use to restore them, and an employer without claims data in hand has no way to contest that adjustment when it arrives. The data here isn't a cause for alarm so much as a description of the conditions an employer is negotiating inside. In a tighter market, the employer who has already read their own loss ratio report is the one positioned to push back with something more than a budget objection.
The loss ratio ladder: which funding options each tier of claims experience unlocks
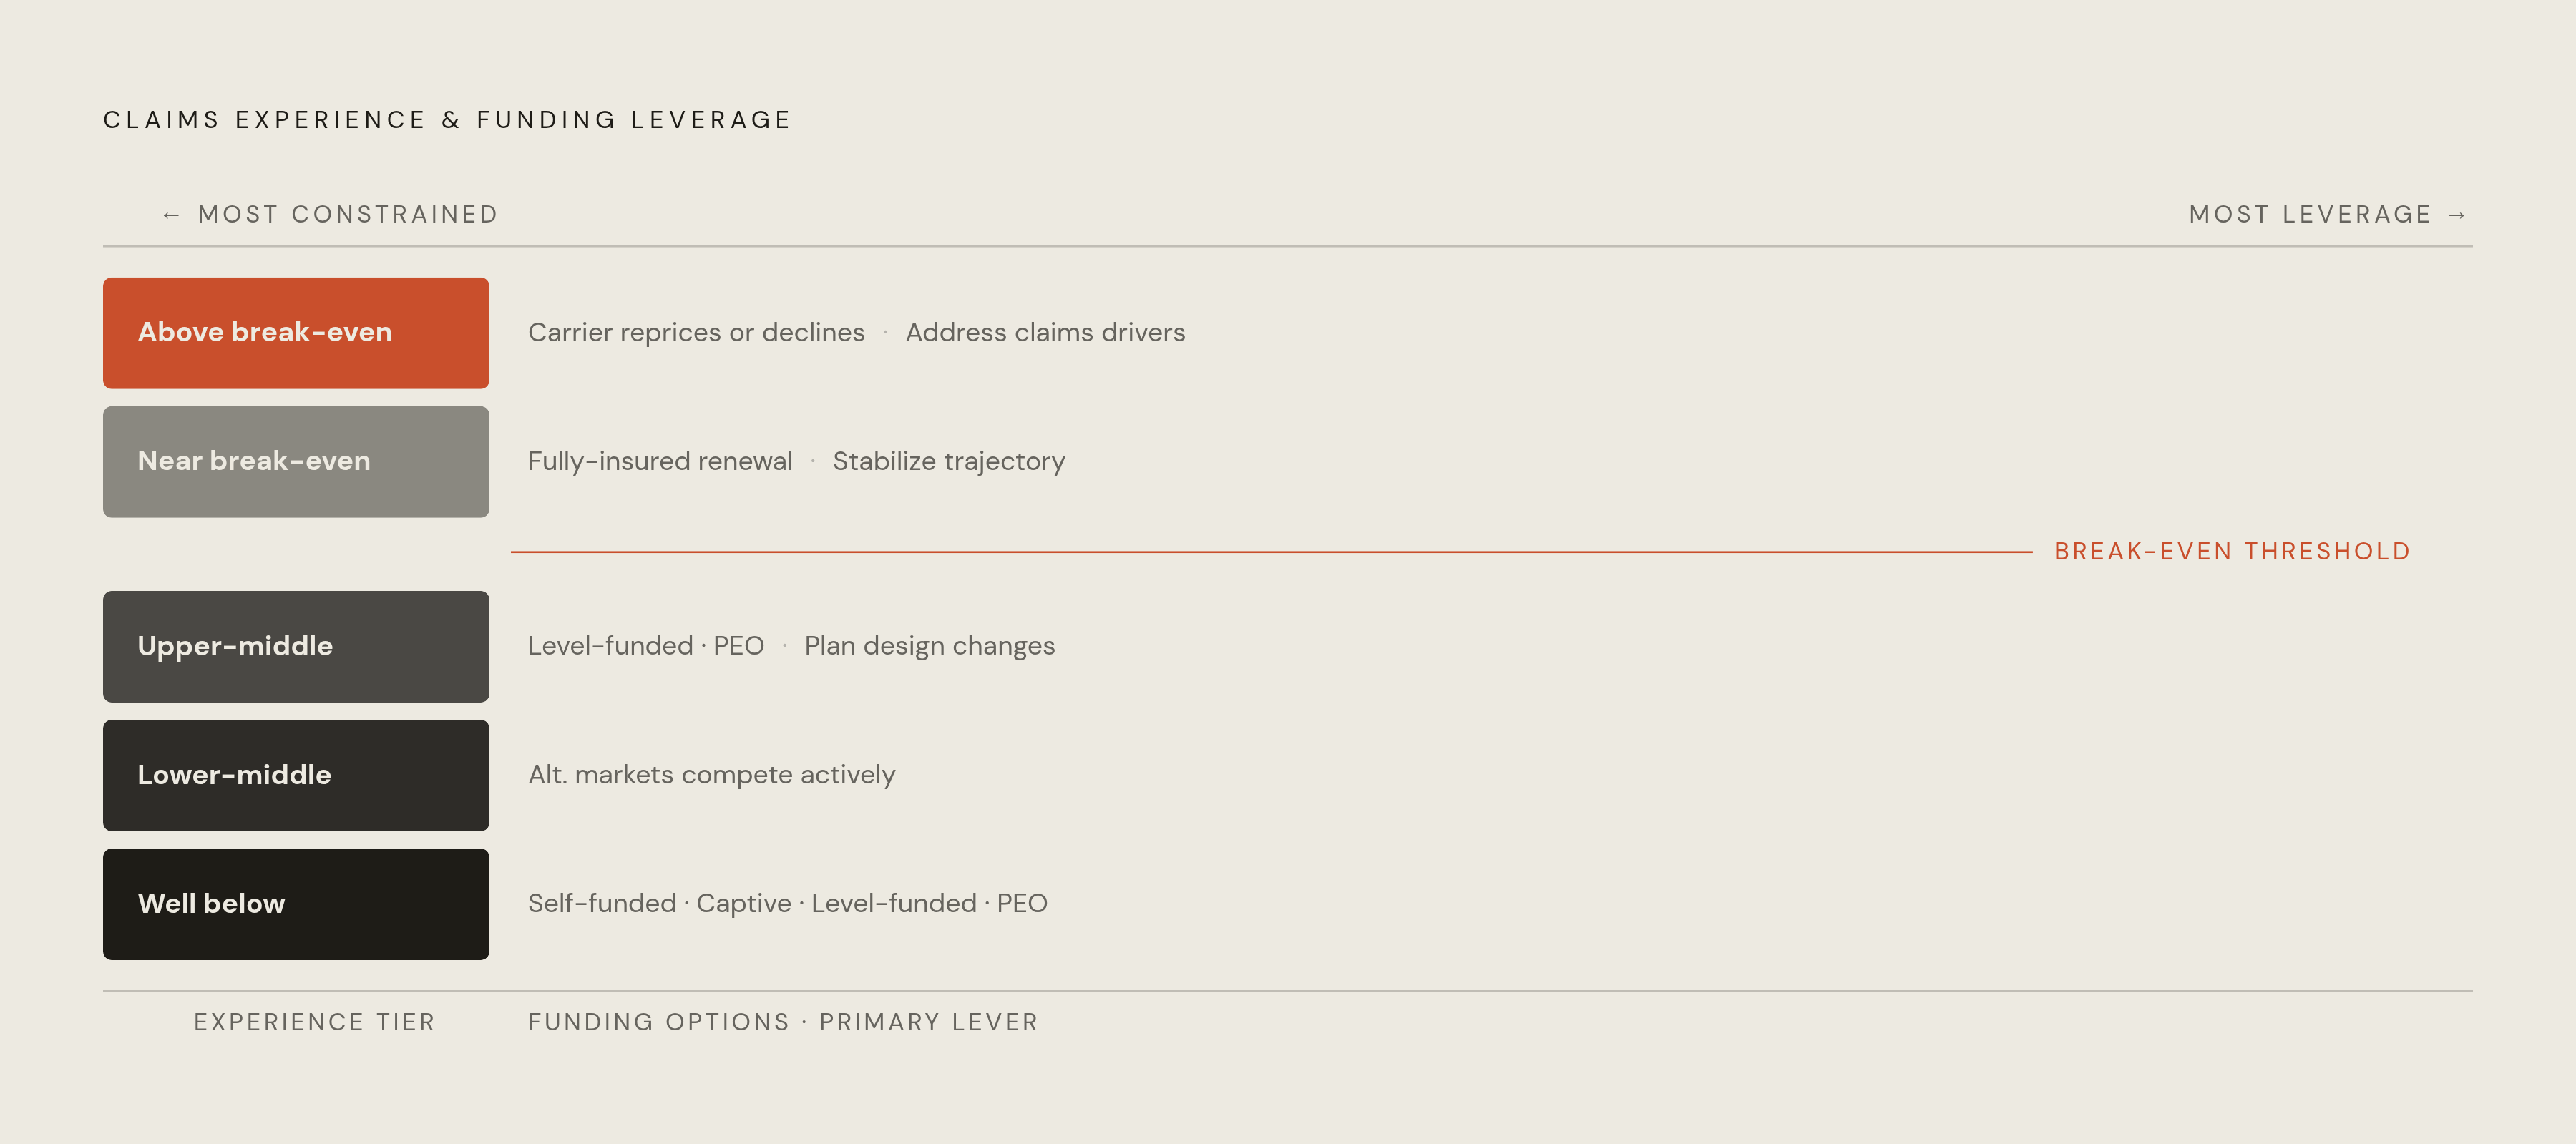
A loss ratio's value lies less in what it says about the past than in what it determines about the options available going forward, including which alternative funding structures the employer can actually pursue and how much leverage exists at the table. The following tiers describe, in general terms, what a group's claims experience tends to unlock.
A group sitting well below the carrier's break-even threshold holds maximum negotiation leverage. Nearly every alternative funding structure remains viable at this tier, including self-funded arrangements, captive structures, level-funded plans, and PEO blended risk pools, and the carrier has a strong incentive to retain a group this profitable.
A group in the lower-middle tier remains profitable to the carrier. High leverage persists here, and alternative markets will actively compete for the business.
A group in the upper-middle tier still has access to some level-funded options and PEO blended risk arrangements, though the negotiating posture starts to shift. Plan design changes, rather than straightforward rate pressure, become the primary lever available at this tier.
A group near the break-even point finds fully-insured renewal the most realistic path forward. The priority at this tier is stabilizing the claims trajectory rather than extracting further rate concessions, since the carrier has little room left to give.
A group above break-even should expect the carrier to reprice aggressively or decline to renew. The employer's priority at this tier is identifying and addressing the underlying claims drivers, not negotiating the rate, because the rate is not the actual problem.
Knowing which tier a group occupies turns the loss ratio from a historical artifact into an instruction: it tells the employer which structural options are realistically on the table before a single conversation with the carrier begins.
What the ACA's MLR thresholds require carriers to disclose
A common assumption among employers is that ACA rules protect them by forcing carriers to keep loss ratios low on every account. That assumption gets the mechanism backwards. The ACA's Medical Loss Ratio rules establish a floor on what carriers must spend on claims, not a ceiling on what they can charge, and the rule applies only to a portion of the employer market. The self-funded majority of employers operates entirely outside this framework.
In the individual and small group markets, insurers must spend at least a defined minimum share of premium income on claims and quality improvement efforts, and the threshold rises to 85% for large group insurers. The ACA MLR rule applies only to fully-insured group plans. About two-thirds of people with employer-sponsored insurance are covered under self-funded plans, where the MLR threshold simply does not apply.
Even for the fully-insured minority, the MLR floor is not a cap on what a carrier can earn from any single group. A carrier can maintain a compliant MLR in aggregate across its entire book of business while pricing one specific group's renewal in a way that produces a materially lower loss ratio on that account alone. The aggregate compliance figure says nothing about how any individual employer was treated.
When a carrier does fall short of its MLR threshold, it owes rebates, but those rebates are calculated on a three-year average. A single high-loss year does not automatically trigger a rebate, and an employer can go without one even in a year where the carrier overpriced the coverage it sold. The claims experience report is what closes this gap. This gap appears in employer-level data that ACA rules were never designed to surface on their own, so an employer waiting on a rebate check to signal overpricing is waiting on a mechanism that was not built to tell them that.
Benchmarking your loss ratio against the right comparison group
A loss ratio figure means little without a comparison point. The same number can represent an excellent result in a year when industry-wide loss ratios are high, and an ordinary one in a year when they are low.
The right benchmark depends on the employer's market segment. For fully-insured large group plans, the 2025 average simple loss ratio in the large group market was 91%, and a group pricing below that figure is meaningfully more profitable to its carrier than the average account in that market. Industry, geography, and workforce demographics all shift what counts as a fair comparison from there. A technology company with a young, geographically distributed workforce has no business measuring itself against an average that includes heavy industrial employers or workforces skewed toward older age bands.
State-level reporting adds a further layer of specificity to this exercise. States including Minnesota require carriers to file annual loss ratio experience reports covering the individual and small employer health plan markets, which gives employers a public reference point for how carriers are actually performing locally. Becker's carrier rankings and KFF's national MLR data serve a similar function at the macro level, offering a way to check a single carrier's trajectory against its peers.
The three-year trailing average carries as much weight in benchmarking as it does in self-assessment. A group that has sat consistently below the market average loss ratio for three consecutive years has a stronger claim to rate concessions than a group that simply dipped below average once. Carriers price renewals on trends, and an employer arguing from a trend rather than a single good year is making the same kind of argument the carrier's own actuaries are trained to respect.
How brokers and advisors can help the employer
A broker's role in this process should be to request, interpret, and present the claims experience report before the employer ever asks for it, but that is not universal practice across the industry. Many brokers never request claims experience reports on behalf of their clients, and some lack the actuarial fluency to interpret them even when the data is in hand. The absence of a standardized process at the broker level means a large share of mid-market employers never see the data that would have changed their renewal outcome.
The incentive structure underlying traditional brokerage work compounds this gap. Brokers are paid by the carriers whose renewal rates they are nominally helping the employer negotiate down, and that arrangement creates a structural tension favoring plan continuity over aggressive benchmarking and renegotiation. A broker who pushes too hard against a carrier's renewal risks the relationship that generates the broker's own commission.
Genuine value at the broker level looks specific: pulling the three-year trailing claims report, benchmarking the loss ratio against industry and geography, modeling the alternative funding structures available given the employer's tier on the loss ratio ladder, and presenting all of it to the carrier as a formal negotiation document. AI-native brokerage models are changing what is feasible at this analytical layer. Where a traditional broker might review a single carrier's renewal proposal in isolation, a platform running AI across workforce data and carrier pricing can model multiple scenarios at once and surface plan design changes an employer would otherwise never see. The employer's best protection in either case is understanding what this analysis should actually look like, so the question at renewal time becomes whether the advisor delivered it, not whether the employer simply accepted whatever number arrived in the letter.
Translating the loss ratio report into a renewal negotiation posture
A loss ratio report is the opening document of the renewal negotiation, and how it gets presented determines how much of the leverage it represents actually converts into a lower rate.
Walking into the renewal meeting, an employer should be able to state five things without hesitation: the group's current loss ratio, the three-year trend behind that figure, the relevant market benchmark for comparison, which tier on the funding ladder that loss ratio places the group into, and what rate outcome that tier reasonably warrants. Each of those five points turns a vague sense that the renewal "feels high" into a specific, defensible position.
Plan design changes strengthen that position further. A group sitting in a moderately elevated range gains more from pairing its claims data with a specific proposed change, adjusted deductibles, a restructured pharmacy benefit, or a revised network, than from presenting the data alone. That pairing shifts the conversation from how much the increase will be to what the employer proposes to change and why the rate should reflect it.
Carriers will likely counter that market-wide cost trends justify the increase regardless of any individual group's claims history, and that argument carries real weight at the industry level. The pressure behind that argument can be addressed with the group's own claims data. The largest carriers' own 2025 MLRs confirm that market-wide pressure is genuine, yet that pressure does not land equally across every group, and a group with a demonstrably profitable claims history has no reason to accept a renewal priced as though it were an average account.
The employers who build the strongest position over time are the ones who benchmark annually rather than only at the moment a renewal letter forces the question. A single favorable year is an anecdote a carrier can dismiss. A three-year trend of below-market loss ratios is a structural argument, and structural arguments are what move renewal numbers. The employer who has done this work before the letter ever arrives walks into that meeting holding the same spreadsheet the carrier has been working from all along, and that, more than any single negotiating tactic, is what changes the outcome at the table.
Sources
- 2026 Medical Loss Ratio Rebates
- Report of ... loss ratio experience in the individual and small employer health plan markets for : insurance companies, nonprofit health service plan corporations and health maintenance organizations. Minnesota Edocs: State Government Publications - Minnesota Legislative Reference Library
- Medical Loss Ratio (MLR) - Research and Data from KFF
- U.S. Health Insurance Industry