PEPM Cost Comparison Across Benefits Delivery Models
Employers must compare total costs across delivery models, not just administrative fees.
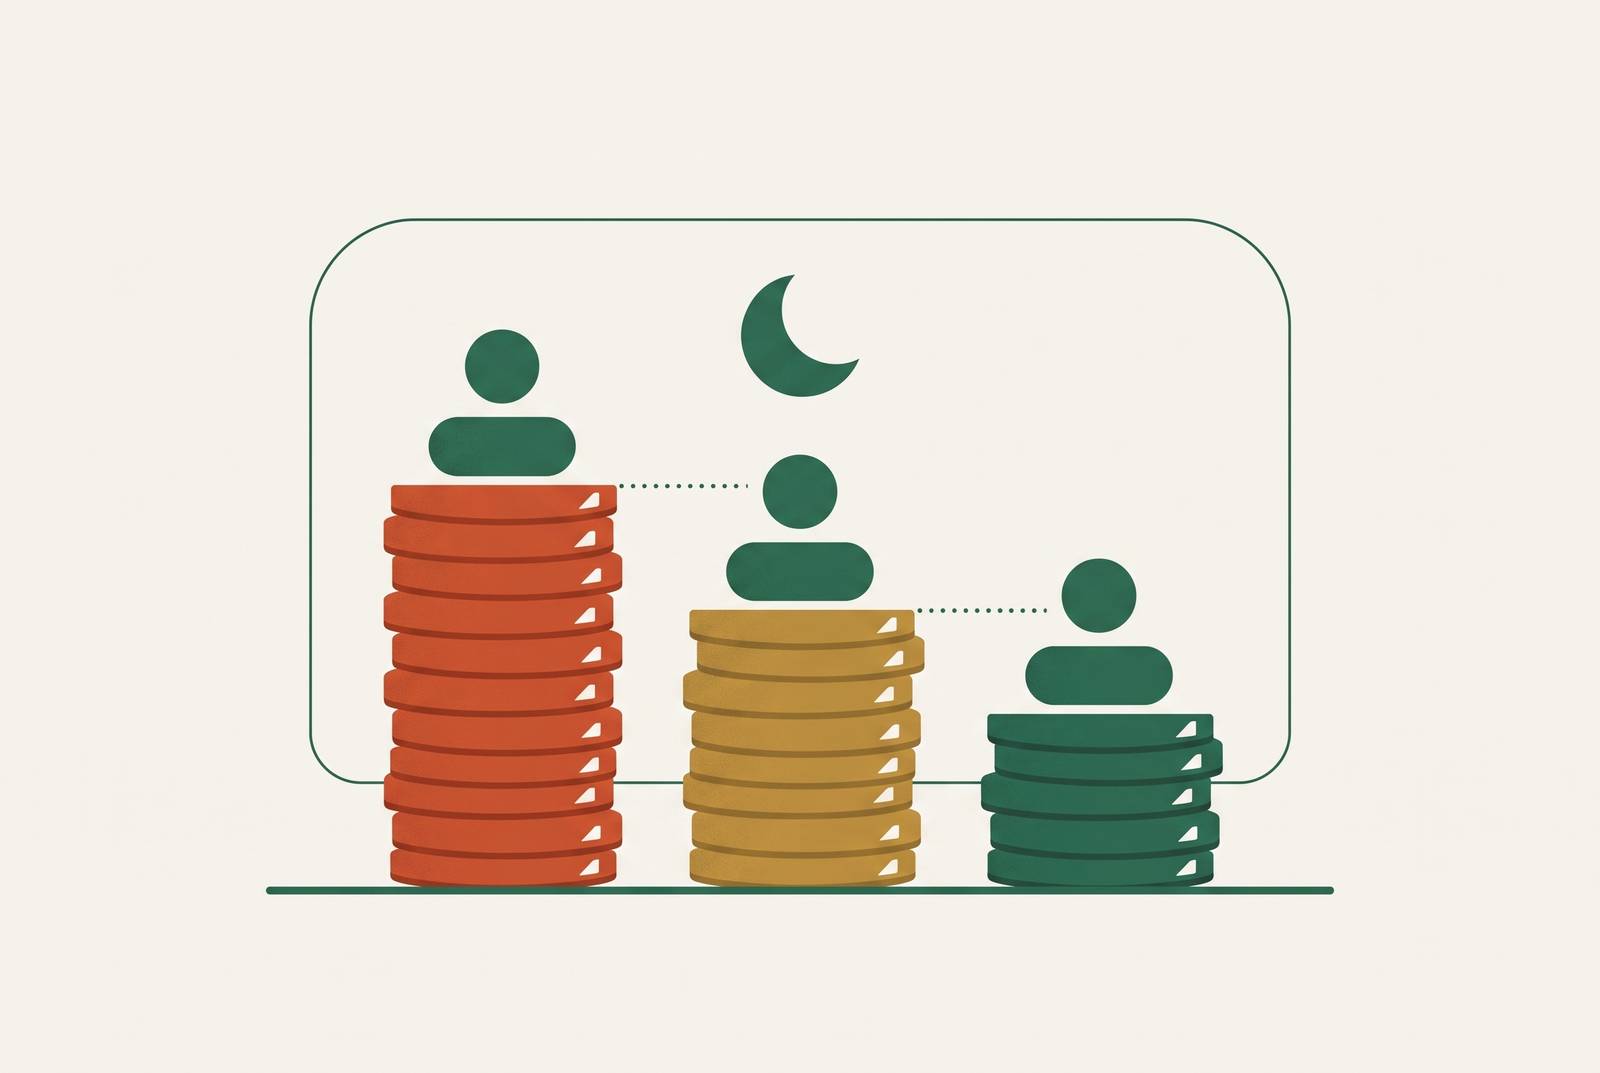
PEPM cost comparison across benefits delivery models requires comparing total employer costs. In 2026, PEO administration runs $40–$160 per employee per month, ASO administration runs $30–$80, and AI-native brokerage subscriptions run $3–$8, while traditional brokers show zero administrative PEPM but receive carrier commissions embedded in premiums. These prices purchase different services, so the least expensive model depends on benefits costs, retained responsibilities, exit exposure, headcount, and wages.
Why the PEPM number on a benefits proposal is not the cost of a benefits model
A founder or CFO receives a proposal with one clean monthly price per employee. The number looks ready for the budget. It appears to make competing proposals comparable, with a lower rate suggesting a less expensive choice. Yet that clarity depends on whether the price includes the same services and expenses as the proposal beside it.
A PEO administrative quote can exclude health insurance, workers’ compensation, retirement administration, platform fees, and one-time charges. Two providers with similar administrative rates can cost much different amounts over a year once charges that recur and costs that depend on use are added. Comparing the headline alone leaves companies budgeting for the administrative layer and discovering the rest at invoice time.
How the two PEO pricing models each create their own blind spot
Flat PEPM pricing makes the administrative charge predictable because it assigns a fixed fee to each enrolled employee. That predictability has a narrow scope, however. Health premiums, workers’ compensation, retirement administration, and platform fees can sit outside the quoted rate and exceed it substantially. Minimum headcount rules and benefit markups can further separate the advertised price from the employer’s actual cost. The blind spot is the boundary of the quote.
Percentage-of-payroll pricing creates a different exposure because the fee follows wages. A company can keep the same workforce and still pay more as salaries rise. For a high-wage employer, salary increases raise the cost of administration even when the services stay the same. The first proposal may look affordable at current payroll but say little about how costs could grow.
Neither structure establishes that a PEO is acting dishonestly. Each requires a different reading skill from the operator. A flat-rate proposal needs scrutiny of exclusions and minimums, while a payroll-based proposal also needs a view of expected wages. Less common hybrid arrangements charge a flat base fee plus a payroll percentage for specific services, so an operator needs to check both before comparing them with another model.
What the full PEO cost stack actually looks like once pass-throughs are included
The 2026 PEO administrative range of $40–$160 per employee per month is only one layer of employer spending. Most of the money sits in pass-through expenses. These include health insurance, dental, vision, life and disability coverage, workers’ compensation charges, retirement administration, and payroll tax handling. A total-cost calculation includes each applicable charge rather than treating the administrative fee as a proxy for the bundle.
Costs that depend on the contract add to the total even if they do not come up every month. Onboarding charges, state registration fees when adding a new hire location, exit provisions, and COBRA administration costs may appear only in contract language, outside the headline proposal. Their timing does not make them incidental. A company expanding into another state or preparing to leave a provider has a different cost profile from one maintaining the same arrangement throughout the year.
Under percentage-of-payroll pricing, a higher salary produces a larger per-employee fee at the same percentage. A high-wage workforce can therefore cost more to administer under that arrangement than under a flat PEPM model, and salary increases widen the exposure. The comparison depends on the actual percentage and flat fee.
Exit exposure also belongs in the calculation. Early termination fees, workers’ compensation coverage gaps during transition, and COBRA administration cost spikes after exit can change the return from switching. The total annual cost per employee therefore needs to account for every invoice line and relevant transition expense.
How the ASO model shifts cost structure without eliminating it
An administrative services organization takes care of payroll, benefits administration, and HR compliance without becoming a legal co-employer. The employer keeps its own EIN, group benefits, and workers’ compensation policy. This removes the co-employment relationship and its associated overhead. It also leaves the employer responsible for costs that a PEO arrangement would organize within its broader structure.
ASO administration costs $30–$80 per employee per month in 2026, which is less than the full range of PEO administrative fees. The employer purchases benefits at independently negotiated rates without the PEO’s pooled purchasing leverage and pays for workers’ compensation at its standalone mod rate. For smaller companies in benefits-intensive industries, higher health insurance costs can offset the administrative reduction.
The decision consequently turns on what the employer already has. A 65-person law firm chose ASO because a PEO would have reduced its PEPM-equivalent administrative cost but required sacrificing its carrier relationship and customized plan design. The lower administrative price was not the decisive advantage.
Similar considerations apply to companies approaching M&A due diligence, where PEO data fragmentation can complicate the process, or seeking HR support without benefits lock-in. ASO separates that support from benefits purchasing. Procurement still needs an owner, whether inside the company or through a separate broker relationship, so the lower service fee does not represent the disappearance of that work.
What a traditional broker actually costs when commissions and inertia are included
A traditional broker’s zero administrative PEPM describes the absence of a direct administrative charge. Carriers pay brokers through commissions that are built into premiums. Comparing that zero with a PEO administrative charge leaves out part of the picture unless it accounts for which services each provides.
The commission structure also affects the economics of renewal. Re-underwriting requires work and may reduce the premium base on which a commission is calculated, while renewing the existing plan preserves that base. This creates an incentive toward plan inertia. It explains why embedded compensation deserves attention beyond its visibility on an invoice.
Without market benchmarking at each renewal, the employer risks paying more than available alternatives require. The cost can remain hidden within an apparently routine premium increase.
Broker-only arrangements are best suited to employers that need insurance placement and already have internal capacity for compliance, employee support, and plan design. That is a narrow fit for growing tech companies. Where those capabilities are missing, their cost remains part of the employer’s operating model even if no broker invoice identifies it.
Where the headcount thresholds shift the math across all four models
Under roughly a few dozen employees, a PEO’s pooled benefits purchasing and compliance infrastructure are hardest to replicate independently. Its administrative fee can be defensible against those capabilities. An employer may pay more overall for standalone coverage even with a lower ASO fee, zero broker administrative PEPM, or a small AI-native subscription. At this scale, the premium differential can outweigh administrative savings.
The balance can shift around roughly fifty to one hundred employees, particularly for high-wage workforces. Percentage-of-payroll PEO charges follow salary growth even with headcount and service scope unchanged. At the same time, the employer has more data and enough headcount to negotiate its own carrier rates. That combination strengthens the case for comparing independent benefits purchasing with the existing PEO bundle.
These bands are directional thresholds. An ASO becomes more relevant where the employer wants operational HR support but can preserve or negotiate suitable benefits independently. Traditional brokerage depends more heavily on internal capacity, while AI-native brokerage adds plan analysis, compliance monitoring, and employee support without recreating the PEO arrangement. Claims history, wages, existing coverage, and retained responsibilities can shift the crossover point, so headcount identifies when to reassess.
What an AI-native brokerage model costs and what it does not provide
AI-native brokerage uses a different cost architecture from PEO administration. Its subscription runs $3–$8 per employee per month in 2026, with carrier-paid compensation as in traditional brokerage. There is no co-employment fee. The model focuses on the quality of plan design, compliance automation, and employee support, while a PEO supplies a broader administrative bundle.
That structure can deliver plan analysis, compliance monitoring, and employee support at a lower administrative cost than a PEO. The services are not equivalent, however. AI-native brokerage does not provide co-employment liability transfer, pooled health insurance purchasing at small-group scale, or workers’ compensation under a master policy. An employer that needs those functions cannot treat the subscription as the full replacement price.
Carriers still pay the broker under this model, as they do in traditional brokerage. Automation does not erase that compensation structure. Its value therefore depends on what the employer receives in plan analysis, compliance support, and employee assistance, rather than on an assumption that a small subscription removes embedded brokerage costs. A broad promise of compliance monitoring also leaves open exactly which support the employer needs.
For a company considering this model at small headcount, the comparison should include standalone group health rates against pooled PEO pricing. A large difference in premiums can use up what the employer saves on the subscription. The employer needs to weigh lower administrative spending against the cost and value of the services it loses, using its headcount, claims history, and ability to negotiate on its own.
How to build a cross-model cost comparison your CFO can actually use
An operator should build the comparison using the same headcount, wage profile, and cost categories for every model. The first category is the administrative fee, annualized per employee whether quoted as PEPM, a payroll percentage, or a subscription. A zero direct broker fee belongs in this category as zero, without implying that brokerage compensation is absent from premiums.
The second category is employer-paid benefits, including health, dental, and vision under each proposed arrangement. Pooled and standalone group rates need separate treatment because changing the delivery model can change the insurance price. Other applicable charges, including workers’ compensation and retirement administration, also belong in the full comparison. A lower administration line cannot compensate for benefits costs left out of the analysis.
The third category is compliance infrastructure, with services that are included kept separate from work the employer must do on its own. This work includes multi-state filings, ACA reporting, COBRA administration, and Form 5500 where it applies. The fourth category is employee support. Benefits navigation through an 800 number in a PDF, a broker account manager, or an always-on concierge tool represents different support arrangements, so the comparison should account for what the employer receives and what remains internal.
The fifth category is exit cost, including early termination exposure, transition costs, and coverage gap risk. Each proposal should answer in writing what its headline number includes and what gets added. Contract language is part of the financial comparison. Without it, the spreadsheet may look complete while omitting expenses triggered by expansion, usage, or departure.
Finally, the operator should run the comparison at current headcount and the workforce expected at the next renewal, with wages treated as a changing input. The model that wins today may not win in 18 months. Running the comparison at each annual renewal shows how premiums, staffing, and service needs have changed before the employer signs up for another year. Annual benchmarking is the discipline that prevents an initially sound choice from becoming an expensive default.